Property assessments made available this week
Posted on Dec 31, 2018
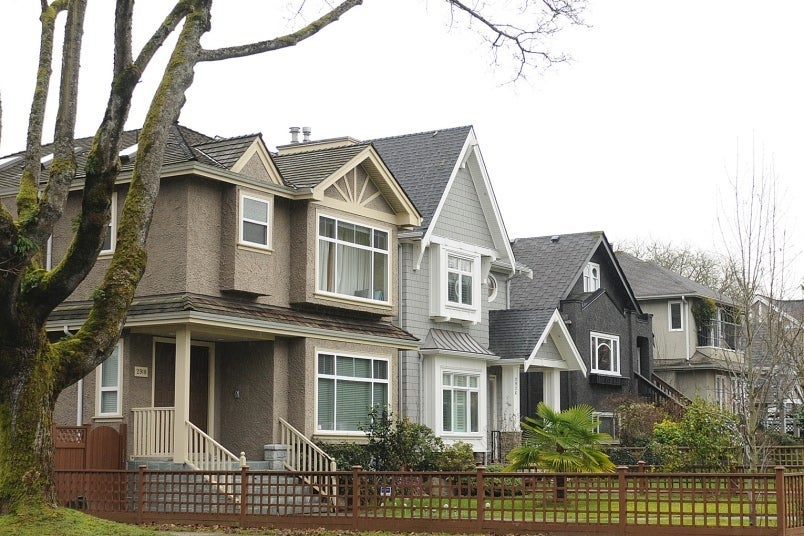
Homeowners across British Columbia will find out what their property is worth when BC Assessment releases its annual assessments this week.
The information will be available at bcassessment.ca after Jan. 2, which will show the assessed value for individual properties as well as the top-val...
In Vancouver’s East Asian communities, a lucky number will cost you
Posted on Dec 27, 2018

Lana Chu says it would take about $10,000 for her to part with her cellphone number, a string of lucky sevens and eights.
Howard Xu really didn't pay quite that much when he bought an eight-heavy number from someone several years ago. But he says the grand total of $7,500 he spent has since helped to bolster the variety of businesses he has linked t...
Canada's housing market correction isn't over, analysts warn
Posted on Dec 22, 2018
Higher interest rates and mortgage stress tests are expected to further dampen the real estate market. Here's what to expect in four different markets.
Canada’s real estate market will likely see further correction in 2019, as fears of higher interest rates and stress tests continue to weigh on the sector, according to analysts.
After a moment of dou...
These interactive heat maps show Metro Vancouver’s most and least expensive home prices
Posted on Dec 21, 2018
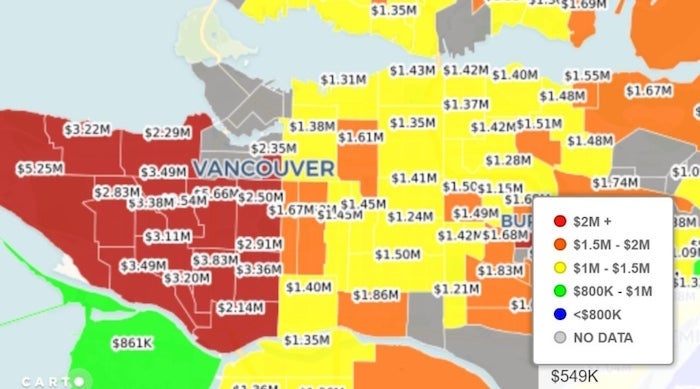
This photo above is a series of interactive heat maps from the real estate website EstateBlock, is a great visual representation of the most to least expensive areas in the Lower Mainland to buy a home.
Using benchmark home price data from November 2018, the website created individual price maps for single-family homes, condos and townhomes, in Metr...
Canada’s priciest condo relisted – at $8M off original price
Posted on Dec 15, 2018

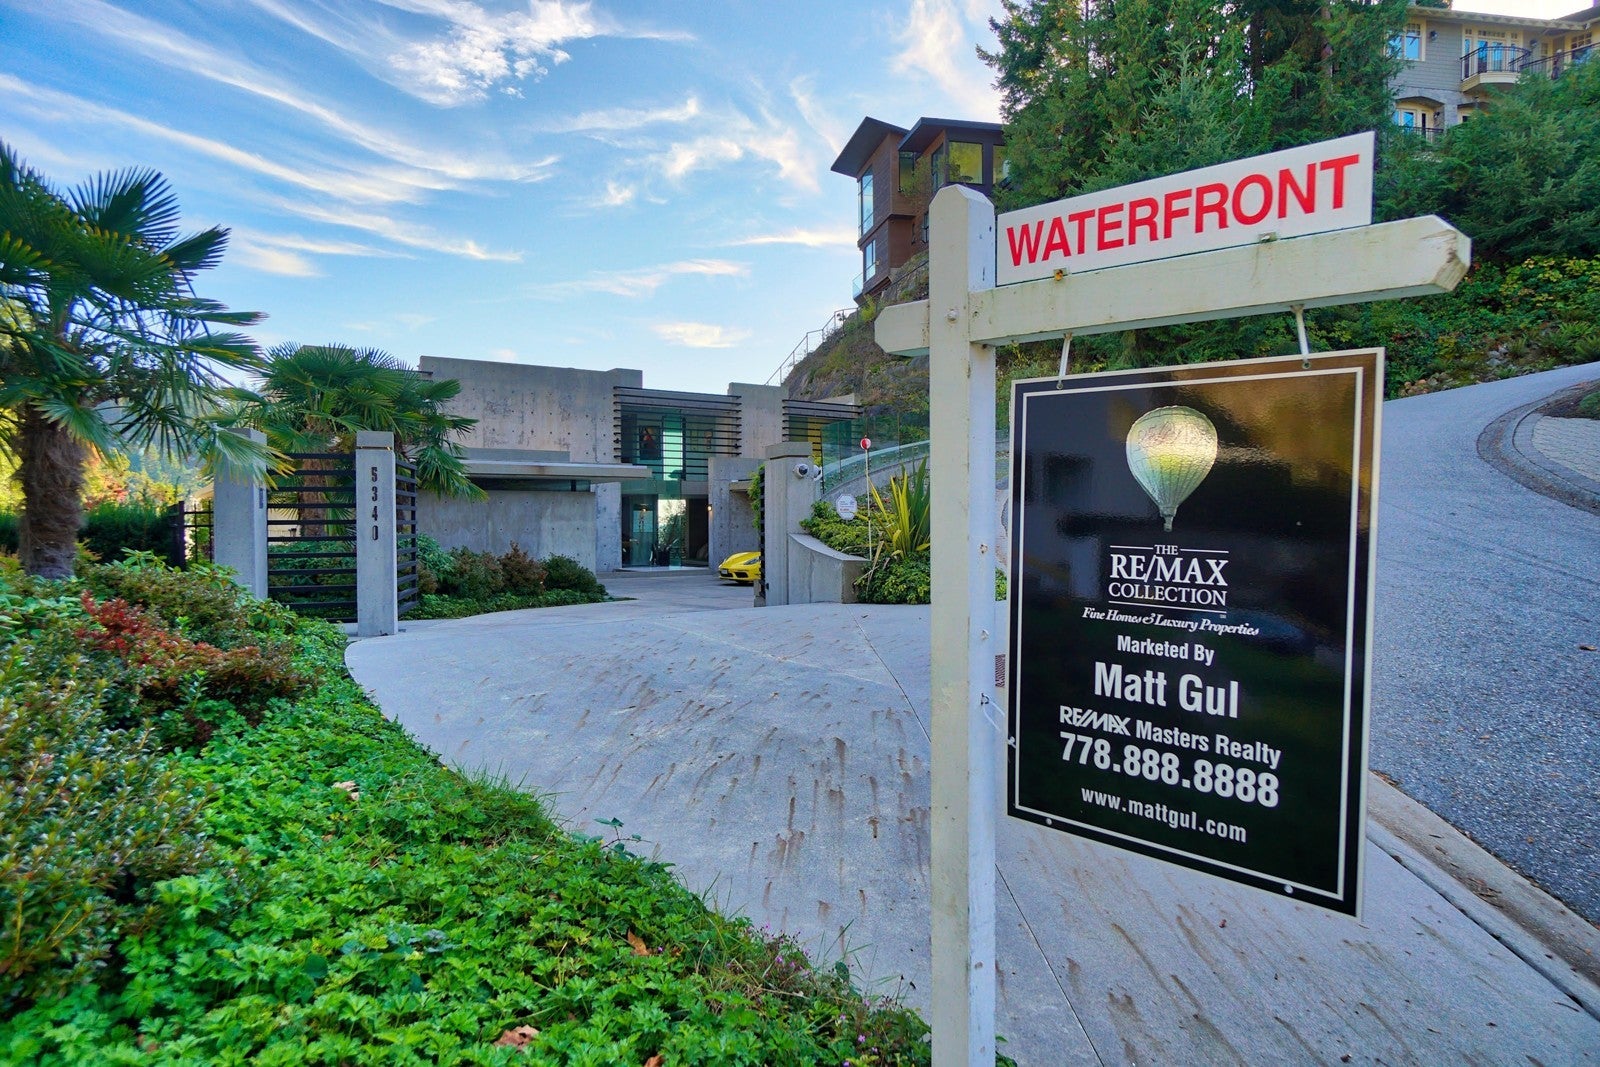
This Two-storey penthouse atop Fairmont Pacific Rim in Vancouver’s Coal Harbour hasn’t sold since January, and is reduced to $29.9 million
The most expensive condo on Canada’s MLS – and the second most expensive home listing in the nation, after this $39.9 million West Vancouver house was re-listed on December 12 at a total of $8 million off its ori...
1313 and 4: Real estate's unlucky numbers and what some cities are doing about it
Posted on Dec 13, 2018
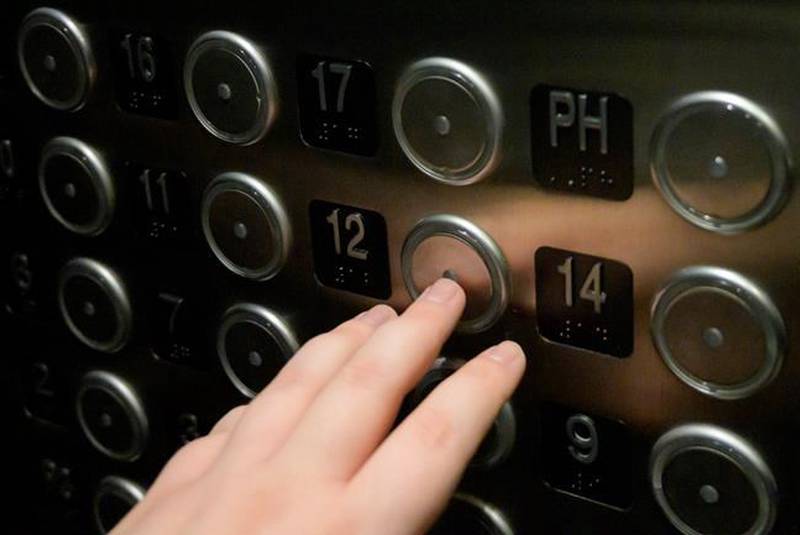
Its widely known among all real estate agents that in certain communities, condo units on the fourth and 13th floor can take longer to sell."When I was younger, I didn't believe any of these things. I thought it was just BS," said Tina Mak, Who has been in the buisness of real-estate in Vancouver for almost 30 years."You don't believe in it but whe...